
I’ve been asked by reviewers to stress test two networks following Jeong & Barabási (2000). Critically the reviewers asked for an exploration of how network diameter changed as progressively larger numbers of nodes were randomly dropped from the networks.
Although the netboot library makes it trivial to do a case-drop bootstrap on a network, it reports a limited set of network statistics and diameter is not one of them.
Here’s an attempt to run a stress test on network diameter for a small (1000 node) randomly generated ring network. I’m sure there are more efficient ways of doing this, and I’m concerned that the algorithm might struggle with the large real-world networks I’ll be applying it to, but I’m proud of the pretty output for now:
library(pacman)
library(tidyverse)
library(tidygraph)
library(igraph)
library(ggplot2)

#Function graphdropstats accepts graph object and number of cases to drop
#drops ndrop cases(vertices) (using uniform random distribution to identify nodes to drop)
#then returns statistic on subgraph, in this case diameter
# V(graph) gives list of nodes in graph
# vcount(graph) gives number of vertices, but more efficient to get this from length of V(graph)

graphdropstats <- function(graph,ndrop){
 keepnodes<-V(graph) #vector of vertex ID's in graph
 droplist<-sample(as_ids(keepnodes),ndrop)
 keepnodes<-keepnodes[-droplist] #vector of positions in keepnodes to drop
 samplegraph<-induced_subgraph(graph,keepnodes)
 return(diameter(samplegraph))
}

#generate graph for testing
graph1<-create_ring(1000)

## sampling with nreps replications, dropping ndrop nodes at random and saving statistics;
## and incrementing ndrop each time until ndropstop
nreps=100
ndropstop=100
ndrop=1
allresults<-vector("numeric", nreps)

for (ndrop in 1:ndropstop){
 result<-vector("numeric", nreps)
 for (i in 1:nreps) {
 result[i] <- graphdropstats(graph1,ndrop)
 }
if(ndrop > 1) allresults<-rbind(allresults,result)
}

allresults <- allresults[-1,] #drop first row of matrix which otherwise is blank
#allresults
matplot(allresults, type='p', pch=15, col=c("gray70"),xlab="N vertices dropped at random", ylab="Network diameter")
index<-1:(ndropstop-1)
lines(index, rowMeans(allresults), col = "red", lwd = 2)

#Edit 27/3/2018: bugfix
This gives us this plot:
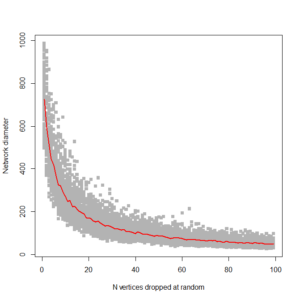
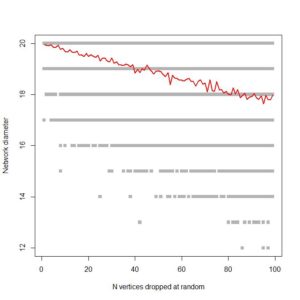
…. which is pretty much what I’m looking for. It shows, as expected, that ring networks are highly vulnerable to node dropout. Compare to a 1000 node scale-free network:
Fingers crossed that it’s efficient enough to run on large co-authorship networks!
-
![[DOI]](https://michaelquayle.net/wp-content/plugins/papercite/img/external.png) Albert, R., Jeong, H., & Barabási, A.. (2000). Error and attack tolerance of complex networks. Nature, 406(6794), 378–382.
Albert, R., Jeong, H., & Barabási, A.. (2000). Error and attack tolerance of complex networks. Nature, 406(6794), 378–382.
[Bibtex]@article{Jeong2000, title={Error and attack tolerance of complex networks}, volume={406}, url={http://dx.doi.org/10.1038/35019019}, DOI={10.1038/35019019}, number={6794}, journal={Nature}, publisher={Springer Nature}, author={Albert, Réka and Jeong, Hawoong and Barabási, Albert-László}, year={2000}, month={Jul}, pages={378–382}}